Energy Dashboard - Cards also for other dashboards?

The Energy Dashboard provides a comprehensive overview of energy consumption immediately after installation, but its customization options are very limited.
Energy dashboard = collection of special Lovelace cards
In general, the Energy Dashboard is a collection of special cards. Embedded in the Energy Dashboard, these provide a really good overview out of the box with minimal configuration effort, but unfortunately with very few customization options. Don't get me wrong: the dashboard is great and I use it every day, but the longer I use it, the more I want to be able to customize or add a few little things.
Making functionality accessible for other dashboards?
The functionality and possibilities of the existing standard cards are not yet sufficient to implement all the functions of the energy dashboard. For example, the energy dashboard has a date picker for selecting a time range. Unfortunately, this energy date picker only works with the energy cards. At this point, it appears that the developers wanted to publish the energy dashboard quickly without creating the foundation for it. The topic is well known and therefore there is an effort to make the functionalities accessible for all cards. One example of this is the ability to use the date picker for the statistics graph card, see: Statistics Graph: Date / Time Selection.
Energy cards in a separate view
The cards of the Energy dashboard can be used in any other view. To do this, add a card and:
| Card | YAML code |
|---|---|
| Energy date picker |
The optional key "collection_key" can be used to link the date picker to specific cards. To do this, simply add the collection_key to the following cards. ✓
The date selection can also be used for statistics charts, see: Statistics chart: Date / Time selection |
| Energy usage graph |
|
| Solar production graph |
|
| Gas consumption graph |
|
| Water consumption graph |
|
| Energy distribution |
|
| Energy sources table |
|
| Grid neutrality gauge |
|
| Solar consumed gauge |
|
| Carbon consumed gauge |
|
| Self-sufficiency gauge |
|
| Devices energy graph |
|
| Detail devices energy graph |
|
| Sankey chart (currently not documented: status 2025.1) |
|
A GitHub pull request for adding energy cards to the Card Picker indicates that something might change on the energy dashboard in the near future. The request would have made it possible to add the energy cards via the interface without YAML, but has been put on hold for the time being.
Other special cards?
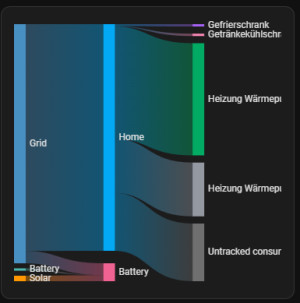
As a further addition to the Energy Dashboard, the Sankey Chart Card was included in the 2025.1 release of Home Assistant without being mentioned in the release notes.
Sankey-Chart-Card
The Sankey Chart Card can currently be used in a manually created Energy Dashboard:

Short field report on the functionality
Now and then I wanted the statistics for the last 365 days rather than the last calendar year, which can't exactly be done with one click using the date picker. When selecting, for example, mid-December last year to mid-December this year, I then noticed that the calculation of the statistics was made up of the whole of December twice: 13 months, which is completely unexpected behavior for me. This was triggered by the fact that entire months are always displayed for time spans greater than one month and the calculation is linked to the display. For this reason, I created a pull request on GitHub: When selecting outside an entire month, the dashboard now uses single days: more of a quick workaround. In another request, I added additional time periods: last 24 hours, last 30 days, last 365 days.
Sources:
- Add (hidden) energy cards to card picker: https://github.com/home-assistant/frontend/pull/23499
- Fix Energy-Dashboard unexpected Period Calculation: https://github.com/home-assistant/frontend/pull/23458
- Add timespans to logbook, energy and history: https://github.com/home-assistant/frontend/pull/23362
- https://www.home-assistant.io/dashboards/energy/
Conclusion
The Energy Dashboard in Home Assistant offers a collection of special cards that provide a good overview but offer limited customization options. Efforts are underway to make the functionalities available for other dashboards, such as the possibility to use the Energy Datepicker for other cards as well. In addition, new cards such as the Sankey chart card have been added and there are discussions about possible improvements such as adding energy cards via the user interface. Overall, the Energy Dashboard provides a useful function, but there is potential for further customization and enhancements.
 ({{pro_count}})
{{percentage}} % positive
 ({{con_count}})