Home Assistant: integrated dashboards
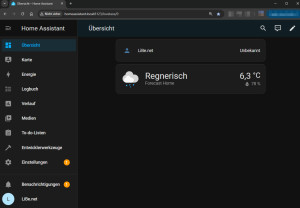
Standard dashboards make it quick and easy to get started with Home Assistant. The dashboards available in every Home Assistant installation: "Logbook" and "History", offer a universal presentation of entities over time. Special dashboards such as "Map", "Media", "To-Do Lists" and the "Energy Dashboard" are designed for specific application purposes.
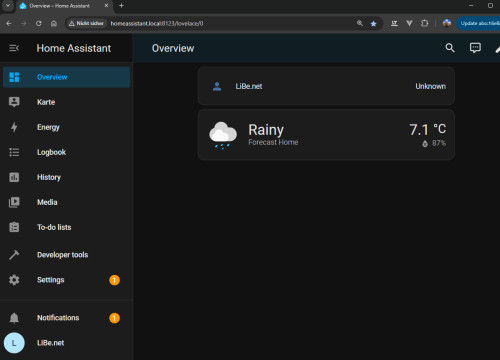
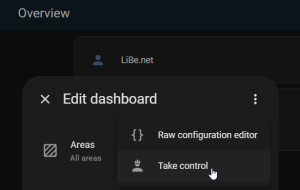
The start page, called "Overview", is automatically compiled from all available sensors. You can create your own dashboards based on this overview:"Take control", or under "Dashboards" settings.
This article is dedicated to the existing, integrated dashboards. The integrated "energy dashboard" is undoubtedly a highlight for all those who want to visualize their energy consumption:
Energy dashboard
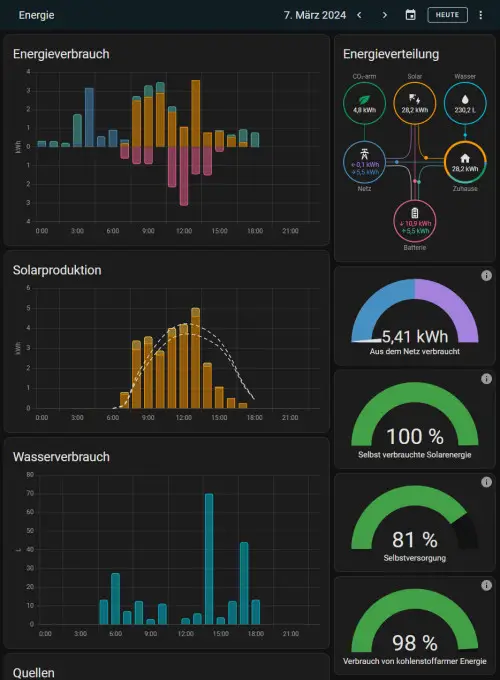
For the display of electricity or water consumption can be visualized very easily via the energy dashboard. Those who own a PV system or a balcony power plant can also display its production and surplus:
In order for the energy dashboard to visualize the data, it is sufficient to add the corresponding consumption meters:
Electricity grid, solar panels, battery storage, gas consumption, water consumption, or other individual devices ...


Details on how the energy dashboard works, see: HA history: more than 10 days? Long Time Statistic (LTS)
For details on the setup, see:
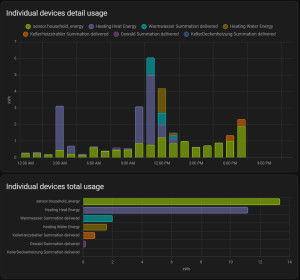
Energy dashboard: example Fronius Gen24 & BYD storage
The Home Assistant Energy Dashboard shows all relevant energy data in a complete overview. Performance data from a wide range of manufacturers or components can be used as the basis for the dashboard. Only sensors with the corresponding performance data are required to supply the interface with data. ... continue reading
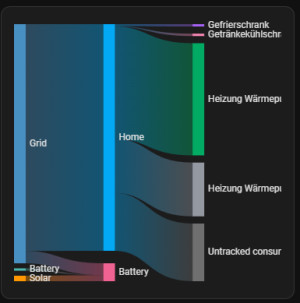
Energy Dashboard - Cards also for other dashboards?
The Energy Dashboard provides a comprehensive overview of energy consumption immediately after installation, but its customization options are very limited. ... continue reading
History
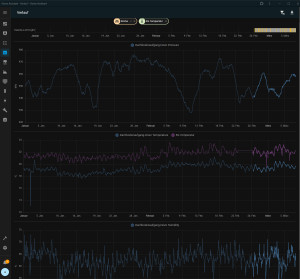
The historical data of the individual devices can be visualized in the course:
Detailed sensor data is available for 10 days, beyond that only long-term statistical data is available, depending on the entity. How long the sensor data is retained can be configured with the following setting:
Setting: purge_keep_days integer (optional, default: 10) in the configuration.yaml file:
recorder:
  purge_keep_days: 10
See, www.home-assistant.io/integrations/recorder/, or to use a database other than SQLite: Home Assistant database MySQL vs. SQLite and to connect to an InfluxDB, see: InfluxDB: Time series database - Docker and for visualizing: Grafana: Docker - Visualize data and define alarms.
The history is still a somewhat neglected core function of Home Assistant
The Home Assistant history was often criticized because its functions were outdated and did not receive any significant updates for a long time. Since the beginning of 2025, there has at least been a zoom function. Although the Energy Dashboard and the History could offer functional synergies, the History was neglected in favor of the Energy Dashboard. The energy dashboard received numerous innovations, while the history as a core function remained without significant improvements. To change this, I decided to set an example and tried to customize the source code of Home Assistant itself. As a first step, I implemented forward and back buttons.
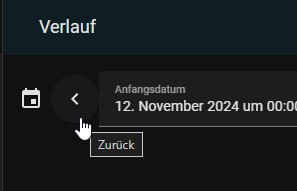
✓ Home Assistant history: previous and next buttons
Back and forward buttons in Home Assistant: My pull request in Github was accepted and has quietly migrated to the Home Assistant release 2024.12. Since 2025.1, the buttons are also visible on mobile devices thanks to a further layout adjustment. ... continue reading
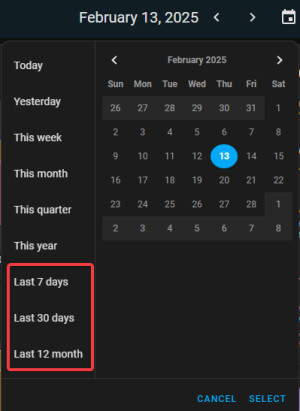
History & energy dashboard: last hour, week, 30 days
In December 2024, I submitted a pull request on GitHub to add additional time spans to Home-Assistant's history and energy dashboard. The time spans are expected to be part of the 2025.3 release. ... continue reading
Settings
Detailed adjustments to the system configuration can be made in the "Settings" menu item. From the integration of new devices to the management of automations, all options are centrally accessible here.
 ({{pro_count}})
{{percentage}} % positive
 ({{con_count}})
